
The Office of the Controller General of Patents, Designs and Trade Marks (hereinafter referred to as the ‘Office’), aims to meet requirements of constantly changing IP landscape and aspires to strengthen the culture of transparency, accountability and efficiency in its management. It endeavors to establish a vibrant and balanced IP regime in the country to support the country’s innovation and developmental objectives. The Office has undergone sweeping transformations due to various initiatives for easing of access to all stakeholders, augmenting efficiency in processing of IP applications, accomplishing uniformity and consistency in the examination of application, strengthening transparency and dissemination of IP related information, nurturing bilateral co-operation at the international level and leveraging the level of IP awareness amongst the public.
With its responsibilities in mind, the Office on April 03, 2017, released its Annual Report for the year 2015-16. The details of the activities performed by various offices under the Office during the year 2015-16 as well as the revenue and expenditure details of all offices under the Office and other relevant statistics are also included in it. Some of the highlights are mentioned in detail below:
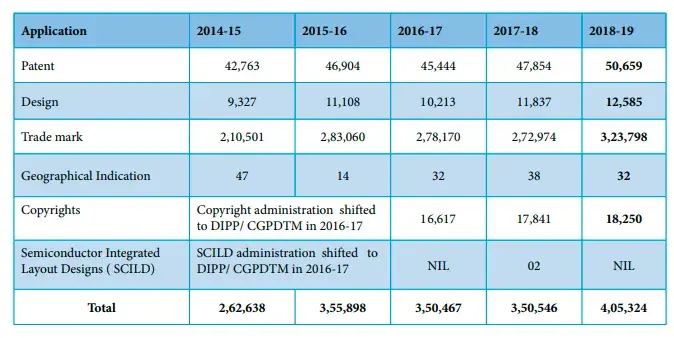
The Intellectual Property Annual Report shows that this year overall filing of applications for various IPRs (4,05,324) has been higher as compared to the previous year (3, 50,546), exhibiting an overall increase of 15%.
Trends in last five years with respect to filing of IP applications are shown below:
PATENTS
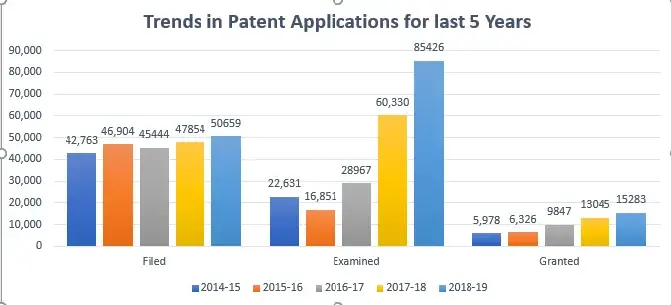
During this year, 50,659 patent applications were filed exhibiting an increase of 5.9% in the filing as compared to the previous year. The trends of last five years in respect of patent applications filed, examined, granted, and disposed are given below. Disposal of applications includes patents granted/refused by the patent office and applications withdrawn and abandoned by the applicants. Further, during 2017-18, the domestic filing has increased to 33.6% as compared to 32.5% in 2017-18.
| Year | 2014-15 | 2015-16 | 2016-17 | 2017-18 | 2018-19 |
| Filed | 42,763 | 46,904 | 45,444 | 47,854 | 50,659 |
| Examined | 22,631 | 16,851 | 28,967 | 60,330 | 85,426 |
| Granted | 5,978 | 6,326 | 9,847 | 13,045 | 15,283 |
| Disposal | 14,316 | 21,987 | 30,271 | 47,695 | 50,884 |
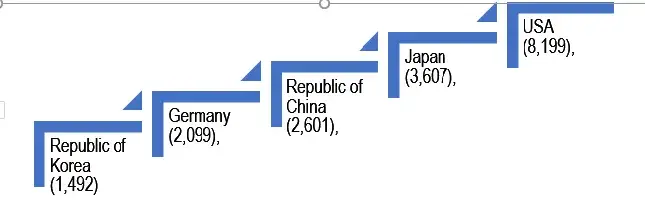
With regards to foreign filing applications the top filing countries are:
DESIGNS
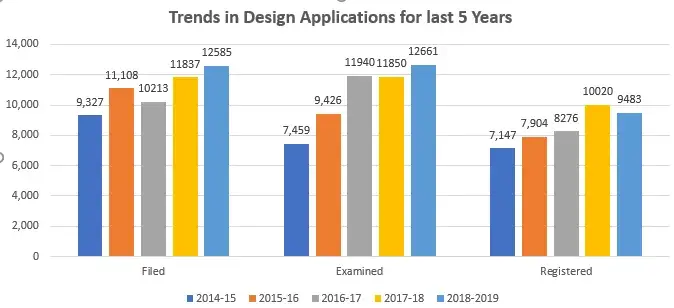
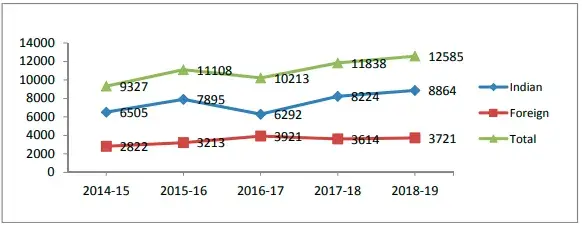
During this year, a total of 12,585 design applications were filed exhibiting an increase of 6.3% over the last year. The number of design applications examined was 12,661 showing an increase of 6.8%. Although the number of design registrations decreased marginally, disposal of design applications increased by 5.8% in 2018-19 as compared to 2017-18.
| Year | 2014-15 | 2015-16 | 2016-17 | 2017-18 | 2018-19 |
| Filed | 9,327 | 11,108 | 10,213 | 11,837 | 12,585 |
| Examined | 7,459 | 9,426 | 11,940 | 11,850 | 12,661 |
| Registered | 7,147 | 7,904 | 8,276 | 10,020 | 9,483 |
| Disposal | 7,218 | 8,023 | 8,332 | 10,788 | 11,414 |
The filing trends of Indian and foreign origin are:
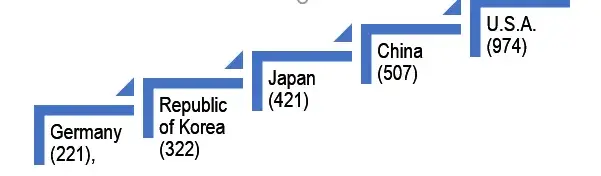
With regards to foreign filing applications the top filing countries are:
TRADEMARKS
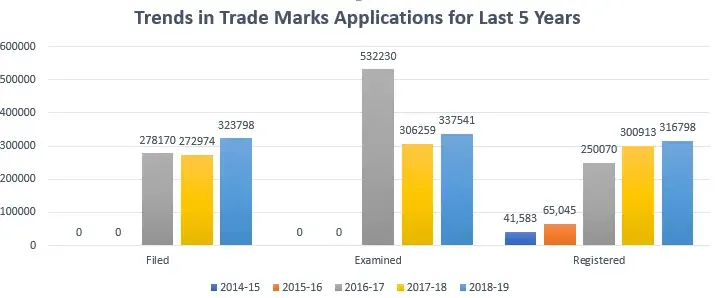
During this year, 3,23,798 applications of trademarks were filed. The number of applications examined is more than applications filed during this period and pendency in examination has been brought down to less than a month. The number of trademark registrations showed an increase of 5.3%.
| Year | 2014-15 | 2015-16 | 2016-17 | 2017-18 | 2018-19 |
| Filed | 2,10,501 | 2,83,060 | 2,78,170 | 2,72,974 | 3,23,798 |
| Examined | 1,68,026 | 2,67,861 | 5,32,230 | 3,06,259 | 3,37,541 |
| Registered | 41,583 | 65,045 | 2,50,070 | 3,00,913 | 3,16,798 |
| Disposal | 83,652 | 1,16,167 | 2,90,444 | 5,55,777 | 5,19,185 |
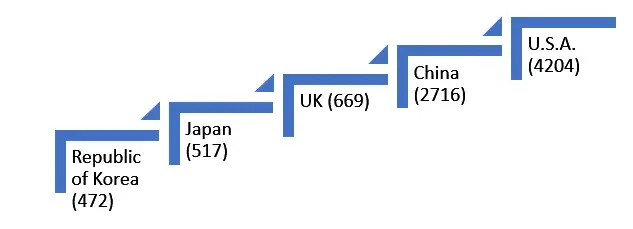
Out of total 323798 applications filed with the Registry; the number of applications filed by foreign applicants during the year was 13682. The top filers are:
GEOGRAPHICAL INDICATIONS
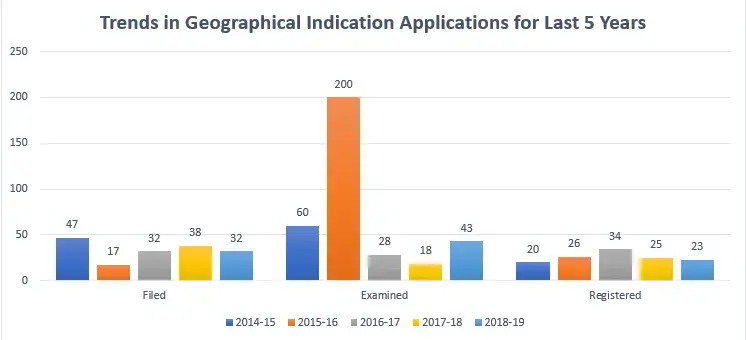
During this financial year, a total of 32 applications were filed and 35 applications were examined. A total number of 23 Geographical Indications were registered. The trends in GI applications filed, examined, and registered during the last five years are given below.
| Year | 2014-15 | 2015-16 | 2016-17 | 2017-18 | 2018-19 |
| Filed | 47 | 17 | 32 | 38 | 32 |
| Examined | 60 | 200 | 28 | 18 | 43 |
| Registered | 20 | 26 | 34 | 25 | 23 |
Related Posts
Intellectual Property Appellate Board releases its Annual Report